Business Objectives
1. Allow new recruit training content to be delivered in both the LMS and as a mobile application on the iPad.
2. Support new data collection requirements for enrollments, completions, time on page, and assessment results.
3. Visualize the data by different roles and aggregations (by class, learner, instructor, learning center).
4. Visualize overall class progress & receive visual cues and actionable notifications on learning performance.
Approach
We implemented Veracity Learning, our Learning Record Store (LRS) as well as updating the client’s SCORM content to support xAPI. This involved integrating xAPI content tracking for several Basic Military Training (BMT) topics on iPads, provided to students in advance at a bootcamp classroom. Veracity solved the problem of being able to track training outside of SCORM and the LMS by taking the same SCORM content delivered as a mobile app and instrumenting it with xAPI. In addition, Veracity built custom Instructor and Student role-based analytics dashboards for the client to provide new training analytics that weren’t previously possible.
Outcome
As a result of the case study, the client began making mobile and xAPI part of it’s modernization strategy and increased adoption of mobile learning. The customer also began moving their LRS and xAPI strategy to a production environment.
The Solution
Several custom dashboards were created as part of the solution. The dashboards are described below.Actionable Notifications Dashboard
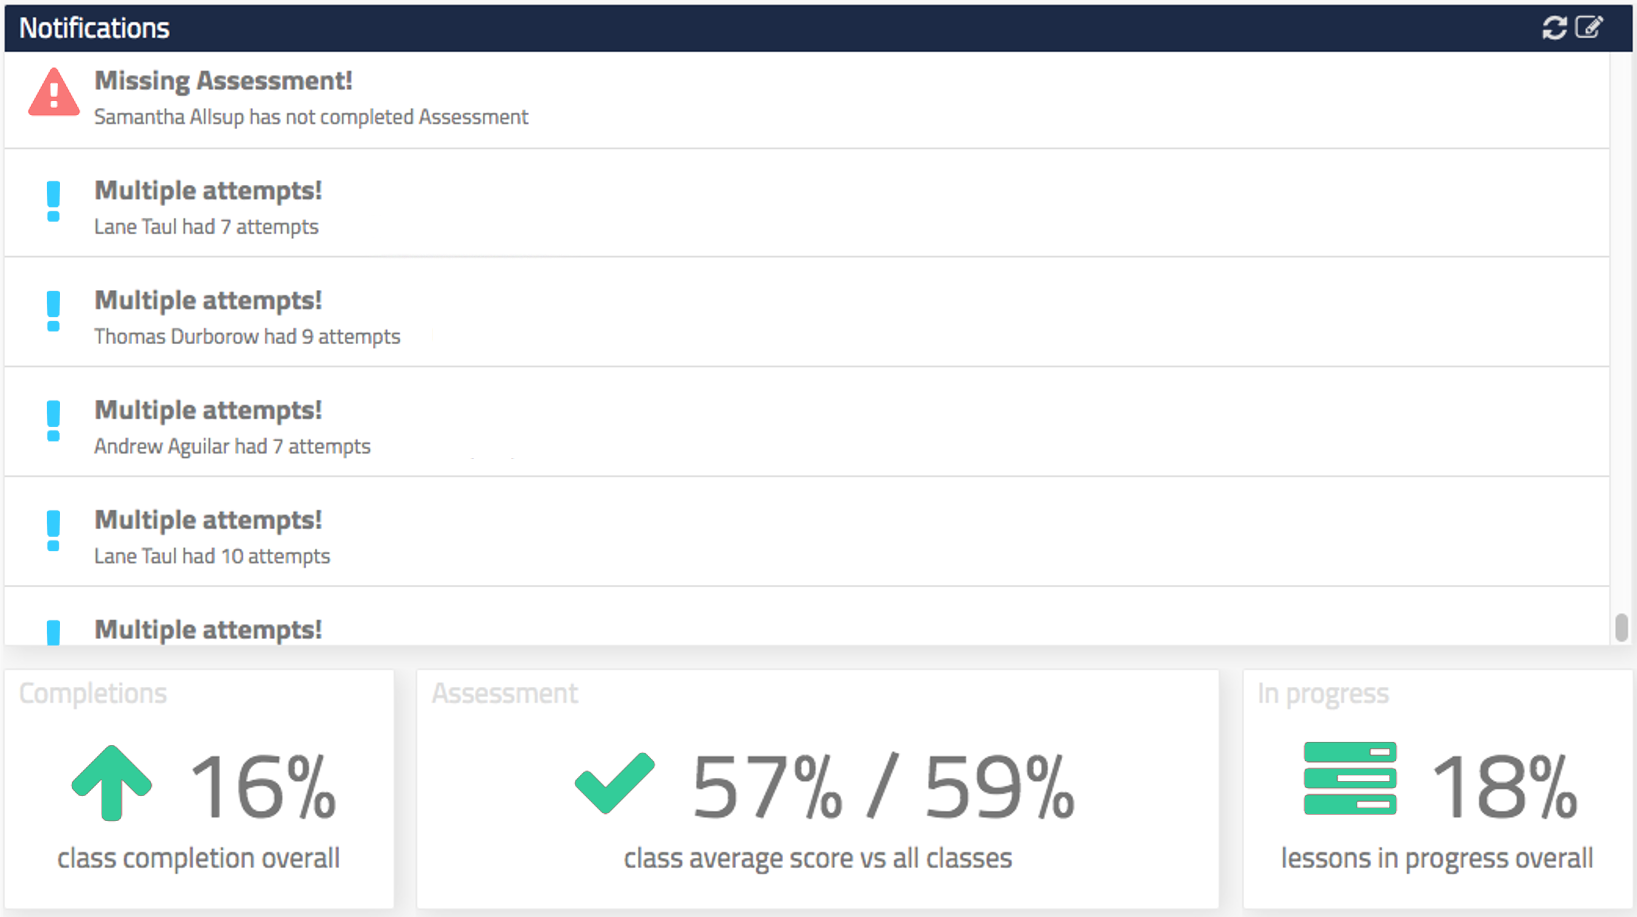
• XAPI-driven dashboards that provide real-time notifications to instructors for potential intervention
• The dashboards identify which students and/or training needs attention without having to manually query the data
• Instructors can also identify repeat occurrences in all training courses where students are having problems
• Instructors can gauge completion percentage of a class compared to other classes and see overall progress metrics

Course Progres & Visual Cues
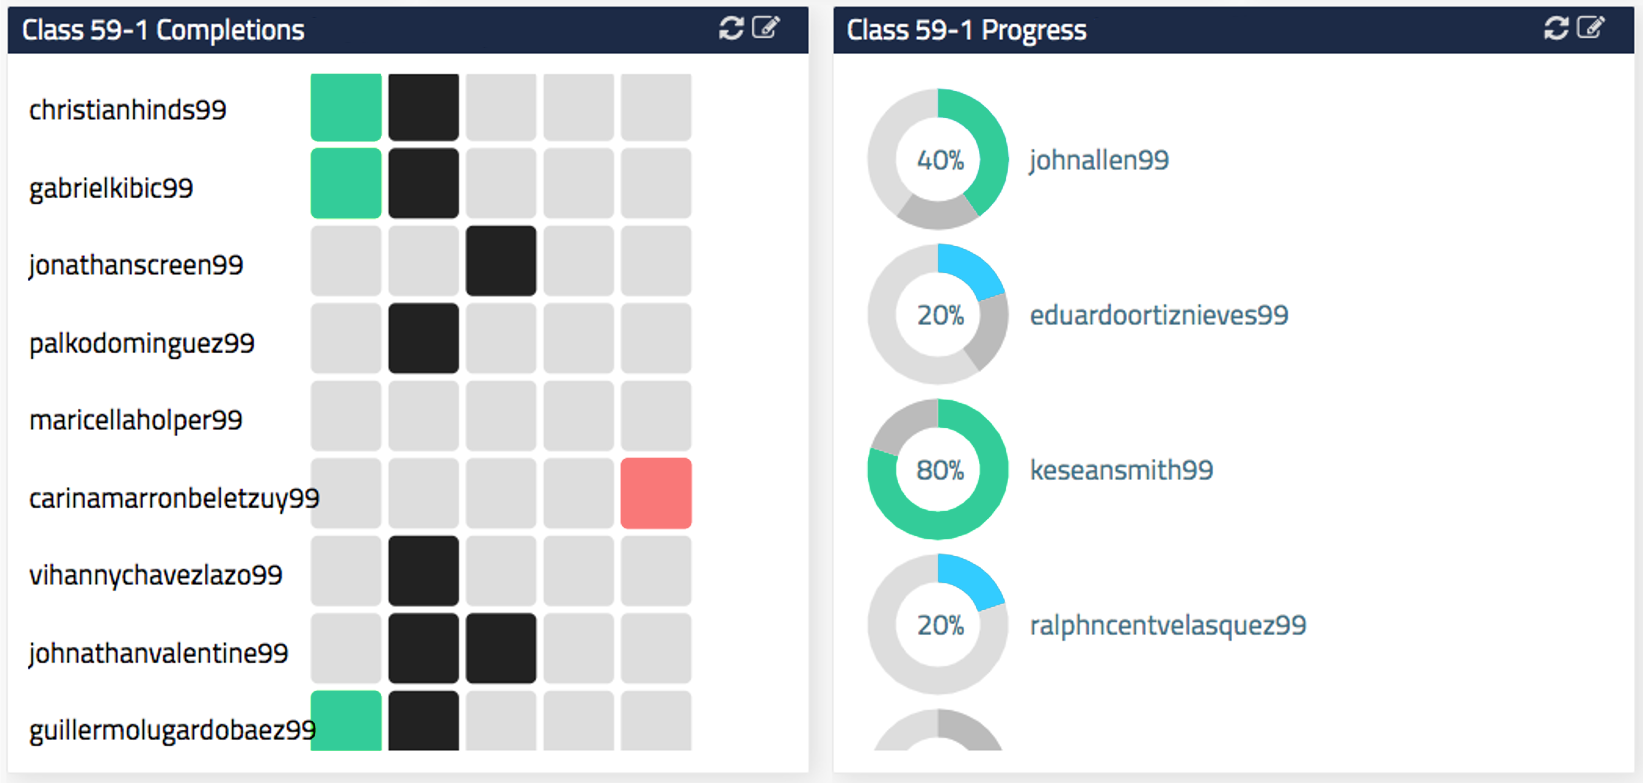
• Provides real-time graphical cues to instructors for when intervention is needed
• Instructors gain quick insights as to which students are falling behind
• Instructors can see overall progress for each student compared to other students
• Used to help determine peer-to-peer tutoring targets. Focuses on pairing students that help fill the gaps.

Assessment Dashboards
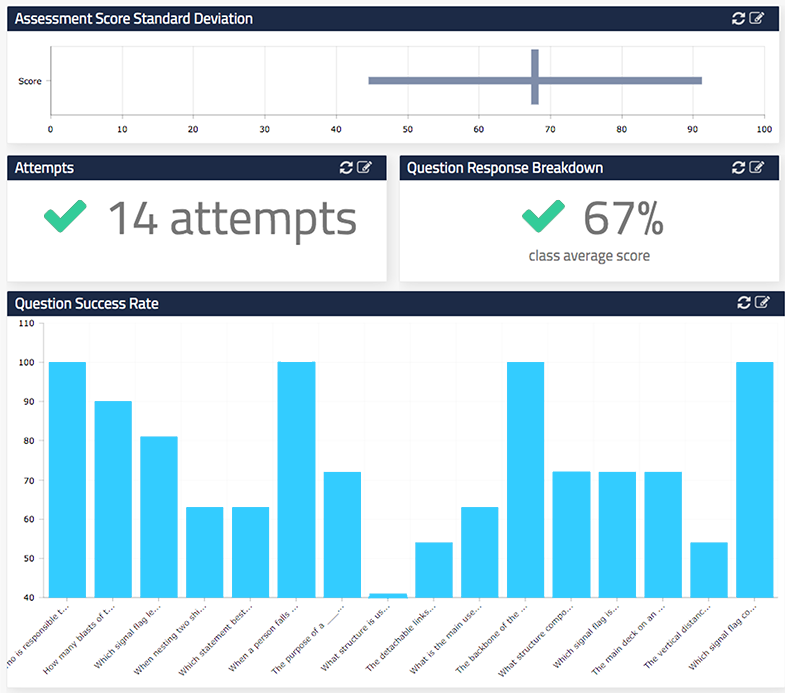
• Provides average score / standard deviation was 67% with 14 attempts
• Instructors can view individual question success rate and the question response breakdown
• With this data, Instructors can find questions that may be too easy, too hard, or even technical issues with content


